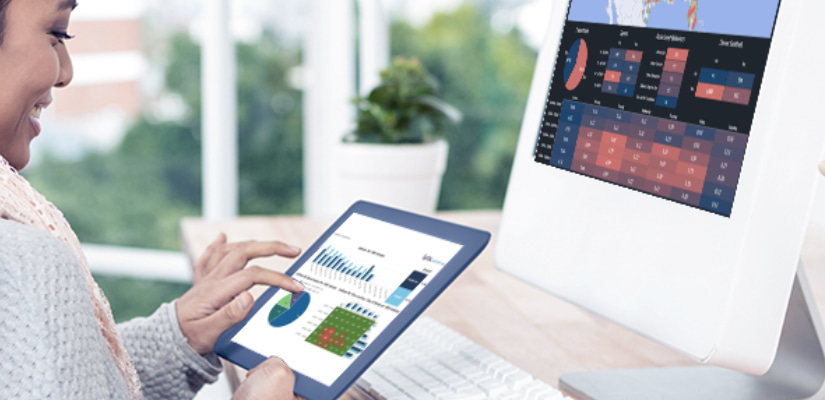
Lytx Intelligence Portal Provides Customers with Behavior and Collision Insights

Lytx customers who want to compare their fleet safety performance with their peers can do so using the recently launched Lytx IntelligenceTM Portal, which is available now to all customers.
Offered as a complimentary feature, the Lytx Intelligence Portal provides collision benchmark trends and industry maps for reviewing collision data and planning safer routes at safer times. Customers can use these reports to discuss trends, anticipate driving conditions, and create better awareness of how a company ranks compared with its peers.
“Our data-driven dashboards help managers see beyond their fleet,” said Erin Baucum, Lytx’s director of client intelligence. “We’ve received a lot of requests from our clients to measure how they’re performing compared to the rest of the industry, so we’re pleased to offer this resource with easy-to-download reports online. It’s another example of our continued efforts to ensure our customers have access to more state-of-the-art reporting tools that better help them manage their fleets.”
Lytx uses its vast database — 1.5 billion miles of driving data each month and 100,000 risky driving events every day — to provide the most accurate picture of risk available. The Lytx Intelligence Portal was born from Lytx Lab, an incubator for new ideas, products, and services.
The portal includes the following dashboards and reports:
Collision Insight Dashboard
This report helps customers assess safety trends, benchmark fleet performance, and analyze route risks. This information can help fleet managers make informed decisions.
The report also analyzes a company’s collision data compared with its industry peers. The report reveals:
- Collision trends aggregated over a limited period of time
- Collisions by speed
- Collision frequency by time and day
Collision Map Industry Analysis
This report looks at a selected industry’s collision trends. The data is presented in four components:
- Collision heat map – shows collision frequency for a specific industry and where collisions are most likely to occur.
- Collision breakdowns – analyzes collision categories such as behaviors, speed, seat belt usage, and even animal strikes.
- Time and day – shows collision distribution by day and time over the past three months.
- Additional insights – shows a breakdown of collisions based on severity, type, weather conditions, and traffic volume.
Customized Reports
The Lytx Intelligence Portal can generate reports based on client demographics for greater relevance:
- Fleet size and geography
- Industry – waste, retail, utilities, field services, freight trucking, government, EMS, automotive, construction, distribution, concrete, and transit
“Together, these reports help our clients understand the environmental and driver factors that occur during collisions,” Baucum said. “Even new Lytx customers can compare their performance. We believe this is a real differentiator and, best of all, it’s a way we can share our rich data with as many of our clients as possible.”
Behavior Benchmarks
Behavior benchmarks show where risk is coming from inside the vehicle.
“This report is a big hit,” Baucum said. “It compares a company’s most prevalent behaviors inside the vehicle to their industry peers.”
The report tracks a company’s most prevalent, coachable behaviors versus the industry average over three months.
Access the Lytx Intelligence Portal
The portal is available for Lytx account users with one of the following roles: Full Access, Safety Manager, Safety Read Only, or Coach. Roles are assigned at the company level. Users without access can gain it by reaching out to their program administrator.
Here are the steps to access:
- Go to intel.lytx.com
- Provide your Lytx account username and password
- Select “login”
The company will announce new Lytx Intelligence Portal features as they become available.
